Growth charts are used to plot a child’s weight, height and head circumference against the the normal distribution for their age and sex. Growth differs between boys and girls, so it is essential to use a sex-specific chart.
On a growth chart:
- Age is plotted on the x-axis
- Weight, height or head circumference on the y-axis
- Each measurement is represented by a dot on the chart
- The curves represent centile lines, showing the normal distribution of growth for healthy children
Centiles
A centile (cent- refers to hundred) indicates how a child’s growth compares to the normal distribution for their age and sex:
- 50th centile: average (50% of children are smaller and 50% are larger)
- 1st centile: smaller than 99% of peers
- 91st centile: taller or heavier than 91% of peers
The pattern over time is more important than a single measurement. A child who is consistently tracking the 9th centile is not a cause for concern, as the 9th centile appears to be normal for them. However, a child dropping from the 91st to the 9th centile suggests faltering growth and requires assessment.
Plotting Growth Charts
Plotting growth charts is a common exam question and a very common task in paediatrics. It is important to practice this skill. Here are some examples (all chart images were taken from RCPCH growth charts).
First let’s plot a 4.5 month old girl that is 6.7kg.
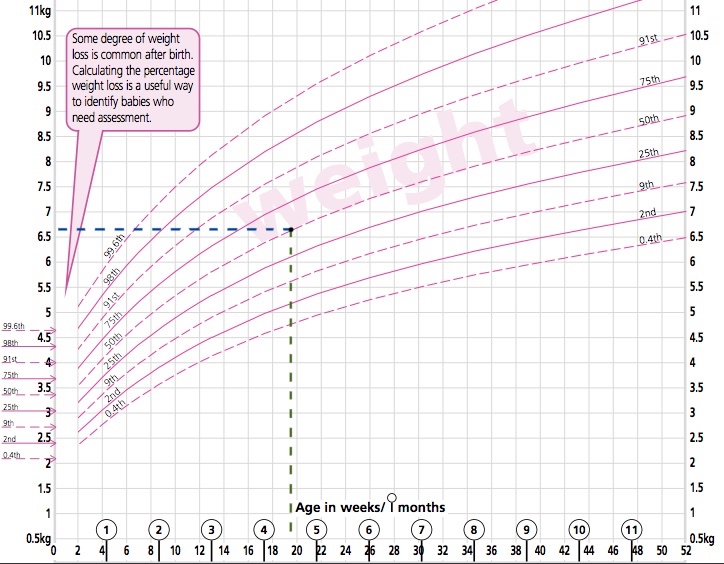
She is almost perfectly on the 50th centile. This means her weight is higher than 50% of girls her age, and lower than the other 50%.
Next let’s plot her again at 1 year of age with a weight of 8kg.

Her weight has dropped to below the 25th centile. More than 75% of girls her age are heavier than her. If she had weighed 6kg at 4.5 months (below 25th centile) her current weight would not be concerning. Her weight falling in centiles raises questions about why she is failing to adequately gain weight.
Phases of Growth
| Phase | Approximate Age | Key Drivers |
| Infancy | Birth → 2 years | Rapid growth driven mainly by nutrition |
| Childhood | 2 years → puberty | Steady linear growth influenced by growth hormone |
| Pubertal | Puberty onset → end of adolescence | Rapid growth driven by sex hormones and growth hormone |
Last updated October 2025
Now, head over to members.zerotofinals.com and test your knowledge of this content. Testing yourself helps identify what you missed and strengthens your understanding and retention.
![]()