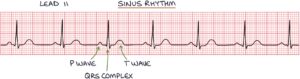
Sinus rhythm is seen on an ECG when the electrical system in the heart is functioning normally. It involves a heart rate between 60-100 beats per minute. Each beat is represented by a P wave, QRS complex and T wave.
Basic Physiology
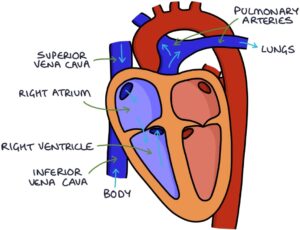
The heart has four chambers. Blood from the body drains from the superior vena cava and inferior vena cava into the right atrium, which pumps blood into the right ventricle. The right ventricle pumps blood to the lungs.
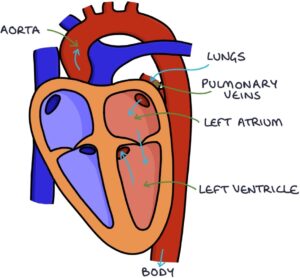
Blood from the lungs drains into the left atrium, which pumps blood into the left ventricle. The left ventricle pumps blood to the body.
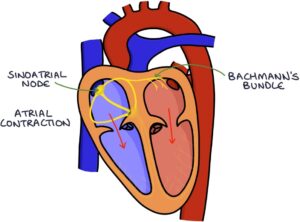
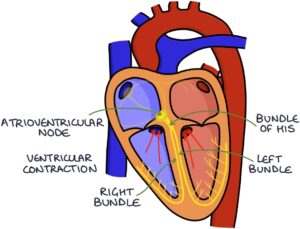
The pumping action of the heart is coordinated by organised electrical activity. Normally, the electrical activity of the heart starts in the sinoatrial node.
The sinoatrial node is the heart’s natural pacemaker, dictating when the heart beats. It is located at the junction between the superior vena cava and the right atrium.
The electrical signal travels through the right atrium and to the left atrium via Bachmann’s bundle. The electrical activity causes the myocytes (muscle cells) in the atria to contract, squeezing blood into the ventricles.
The electrical activity travels through the atrioventricular (AV) node, which is the electrical pathway between the atria and ventricles.
It passes from the AV node to the bundle of His, which splits into the right bundle, taking the signal to the right ventricle, and the left bundle, taking the signal to the left ventricle. From here, it passes to the Purkinje fibres, which take the electrical signal throughout the ventricles, causing them to contract.
The right ventricle pumps blood to the pulmonary arteries and lungs. The left ventricle pumps blood into the aorta and body.
Depolarisation and Repolarisation
The cardiac action potential refers to the change in electrical charge across the cell membrane of the myocytes (heart muscle cells) that stimulates the heart muscle to contract.
There are two essential parts:
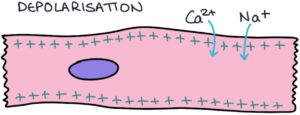
- Depolarisation – leads to muscle contraction
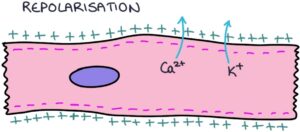
- Repolarisation – where the cells relax and reset for the next contraction
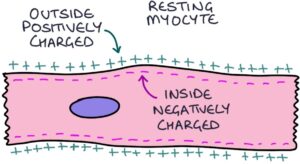
The inside of the myocyte cell is negatively charged compared with the outside. The membrane potential refers to the difference in charge between one side of the membrane and the other. The normal resting membrane potential, when the myocytes are not contracting, is -70 mV (millivolts).
The electrical signal triggers the movement of ions, particularly sodium (Na+) and calcium (Ca2+), which are positively charged, into the cell, causing the membrane potential to go from negative to positive. It goes from -70 mV to +30 mV. This is called depolarisation and triggers muscle contraction.
Following depolarisation, there is a period of repolarisation. Repolarisation is where the myocytes reset back to their resting state, ready for another depolarisation. The muscle is relaxed, and potassium (K+) and calcium (Ca2+) ions are transported across the cell membrane to reset the membrane potential back to baseline.
Lead II and Heart Axis
A 12-lead ECG is produced by recording the electrical signals from 10 electrodes placed across the body. One electrode is place on each limb, and six electrodes are placed across the chest.
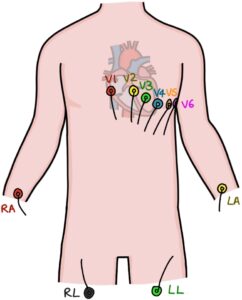
Lead II is usually the optimal lead for assessing the heart rhythm.
Lead II is a bipolar lead, meaning that it represents the electrical changes in the space between two electrodes. One electrode is placed on the right arm (the negative electrode), and the other is placed on the left leg (the positive electrode). The right arm connects to the body at the right shoulder, and the left leg connects to the left hip. Therefore, lead II shows the electrical changes in the space between the right shoulder and left hip. This is considered to be at 60 degrees across the body, where 0 degrees is horizontal from the person’s right to left, and 90 degrees is directly vertical from the head to the feet.
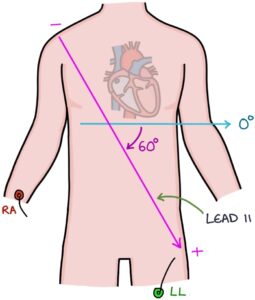
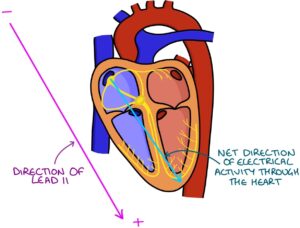
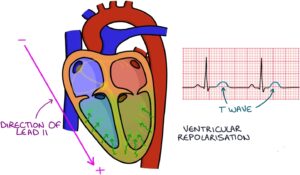
Lead II aligns with the axis of the heart in most people. The axis of the heart is the overall direction that electrical activity flows through the heart, from the sinoatrial node down into the ventricles. Imagine standing on the sinoatrial node and looking in the general direction of travel of electrical activity. The normal heart axis is somewhere between -30 and +90 degrees.
ECG Waves
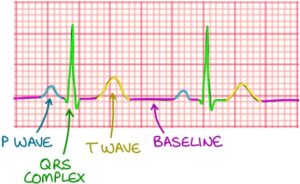
In lead II, there are some key features of normal sinus rhythm.
- Baseline or isoelectric line (resting membrane potential)
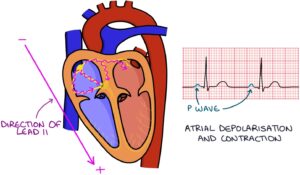
- P waves (atrial depolarisation)
- QRS complex (ventricular depolarisation)
- T waves (ventricular repolarisation)
The sinoatrial node creates an electrical impulse that travels through the atria, causing depolarisation of the atrial myocytes (muscle cells). As this activity moves from the sinoatrial node through the atria, roughly in the direction of lead II (in the same direction as from the right shoulder to the left hip), it is seen as a positive upstroke on the ECG. Once the movement of electrical activity through the atria is complete, the ECG line returns to the baseline. This bump is the P-wave, representing the electrical impulse moving through the atria, causing atrial contraction.
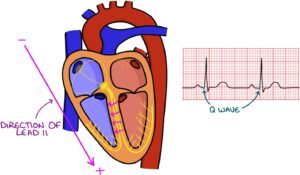
The Q wave is either not visible or small on lead II. It is a negative deflection at the start of the QRS complex. It represents the electrical impulse travelling from left to right in the interventricular septum (the muscular wall between the ventricles).
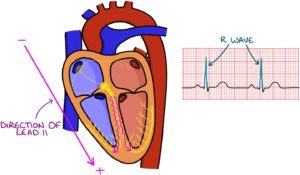
The R wave represents the electrical impulse travelling down to the apex (tip) of the heart and the main depolarisation of the ventricles. This is in the same direction as lead II (from the right shoulder to the left hip), so it appears as a positive upstroke. The R wave is typically the largest part of the QRS complex.
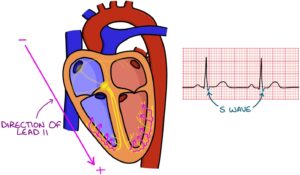
The S wave represents the later stages of ventricular depolarisation after the signal impulse reaches the apex and is travelling away from the apex. This is in the opposite direction of lead II (travelling overall from the left hip to the right shoulder), so it appears as a negative downstroke.
The T wave represents the repolarisation of the ventricles. Repolarisation is where ions are moved across the cell membrane to reset the cells back to their baseline membrane potential. This involves a negative charge spreading from the outside (epicardium) towards the inside (endocardium) of the ventricles, in the opposite direction of lead II, creating a positive upstroke on the ECG trace.
Normal Durations
A standard ECG is recorded at 25 mm/s. The paper travels through the printer at 25 mm every second, meaning that a section measuring 25 mm across the paper is equivalent to one second of heart activity. You can use the grid to assess the pace:
- Small squares are equal to 0.04 seconds (40 milliseconds)
- Large squares are equal to 0.2 seconds (200 milliseconds)
- One second is equal to 5 large squares or 25 small squares
|
Value |
Measurement |
Seconds |
Milliseconds |
Small squares |
|
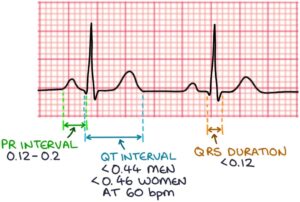
PR Interval |
Start of P wave to start of QRS complex |
0.12 – 0.2 |
120 – 200 |
3 – 5 |
|
QRS Duration |
Start of QRS complex to end of QRS complex |
< 0.12 |
< 120 |
< 3 |
|
Corrected QT Interval (QTc) |
Start of Q wave to end of T wave (at 60 beats per minute) |
< 0.44 men < 0.46 women |
< 440 men < 460 women |
< 11 men < 11.5 women (at 60 bpm) |
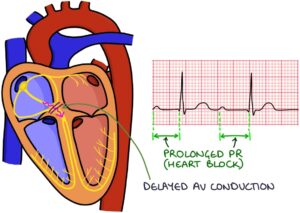
The PR interval represents the time it takes for the electrical activity to travel from the atria to the ventricles. A prolonged PR interval represents delayed conduction through the atrioventricular node. This occurs in heart block.
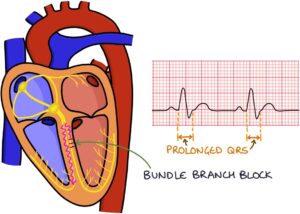
The QRS duration represents the time it takes for electrical activity to spread and depolarisation to occur in the ventricles. A prolonged QRS duration occurs in bundle branch block, where the left or right bundle branch has delayed or blocked conduction.
The QT interval represents the time it takes for depolarisation and repolarisation of the ventricles. It is shorter at faster heart rates. The corrected QT interval (QTc) estimates the QT interval if the heart rate were 60 beats per minute.
A prolonged QT interval represents prolonged repolarisation of the heart muscle cells (myocytes) after a contraction. The QTc is prolonged at:
- More than 440 milliseconds in men
- More than 460 milliseconds in women
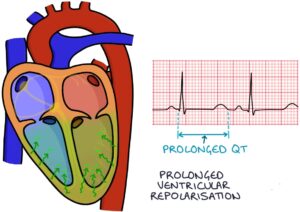
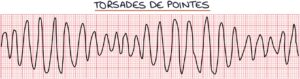
Prolonged QT interval increases the risk of ventricular arrhythmias, particularly torsades de pointes.
Last updated April 2025
Now, head over to members.zerotofinals.com and test your knowledge of this content. Testing yourself helps identify what you missed and strengthens your understanding and retention.
![]()